CELL-DYN RUBY
The results are accurate on the first run
Increase laboratory efficiency
More leukemia and leukemia components results are reported at the first run, even when the blood sample has abnormal cells and jamming components are present:
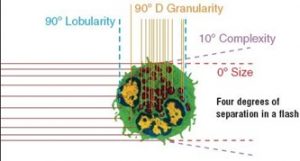
- Engineering MAPSSTM Patent Abbott (Multi-Angle Polirized Scatter Separation): for white blood cell results and 5 precise white blood cells thanks to optical lasers
- Identify accurately by optical scattering measurements at 4 corners
- Application of multiple histogram analysis to identify abnormal blood cells and interfering components
Get platelet results on the first run using optical techniques
- CELL-DYN RubyTM Application of 2-angle optical engineering to count and measure platelet size, ensure accurate platelet results at the first run
- Reduced pattern iteration due to interference from erythrocytes, erythrocyte or white blood cell fragments, and non-platelet components
Sample running mode with difficult red blood cells
- Analysis of erythrocytes and erythrocyte count measured in 3-dimensional optics, erythrocyte and reticulocyte indices
- The optical erythrocyte count technique means fewer samples need a smear
The software is flexible and easy to use
- The screen can be formatted according to the user
- Non-routine modes are easy to execute
Only 3 types of chemicals for whole blood count and 5 leukemia components analyzed
- WBC lyse
- RBC lyse
- Diluent / Sheath
CELL-DYN Ruby: Transformation of advanced engineering
Rich software, convenient touch screen and flexible optimization
Easy to use
- The screen is clear, easy to understand and easy to navigate
- The software can be formatted according to the user (based on the SQL database)
- Displays notification of system problems or can change the time displayed on the screen to optimize the user experience
- Automatically quantify remaining chemical condition
User-friendly software that easily performs inquiries, even non-routine requests:
- Calibration function
- Help function on screen
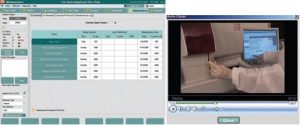
- Help video
Configure security
4 levels of security key by password (password) depending on user role)
Quality control (QC)
Can store up to 500 quality test files
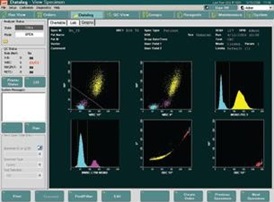 |
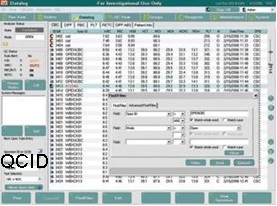
Information display tableInformation on white blood cells, red blood cells and platelets on the sample and quality test results is clearly displayed by color. Flag patterns are easy to identify. The operator can select up to 9 different charts with the push of a button. |
|
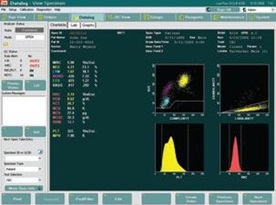
Information for laboratory use onlyOn the lab screen, it is possible to view the auxiliary parameters for the internal laboratory purposes. These parameters include quantity and percentage of BAND, IG, BLST (Blast), VARL (Variant Lymp) in leukemia components. Additional hematological parameters such as platelet and platelet distribution width (PDW) |
 |
Data managementCan store up to 10,000 sample runs and quality control. Data is easy and quickly retrieved thanks to the friendly search menu (menu). |
|
|
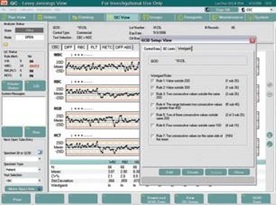
CHeck qualityIn the QC screen, you can move from the Levey-Jennings graphâ to Data Summaries using the function keys below the left QQID DATA and QQIC LJ Plots. |
Maintenance
CHeck quality
In the QC screen, you can move from the Levey-Jennings graphâ to Data Summaries using the function keys below the left QQID DATA and QQIC LJ Plots.
All maintenance information is easily controlled on one screen. The user manual and service instruction video are always on screen.
Abbott's hematology analyzer is at the forefront of efficiency on the first run
 |
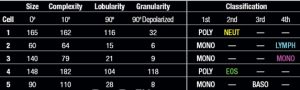
Clearly differentiating cell components thanks to MAPSS techniqueTM: Better cell analysis.
|
Results from MAPSSTM is displayed on many charts in different colors
- Distinguish clearly multi-human leukemia, love toan, alkaline, single-human and lymphocytes
- Identify and differentiate immature cells and interfering components
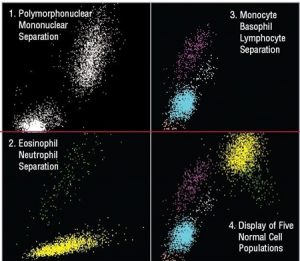
- Distinguishing polymorphonuclear leukemia and mononucleosis
- Distinguish between neutrophils and eosinophils
- Distinguishing monocytes, eosinophils and lymphocytes
- Displays 5 normal leukemia components
The MAPSS technique distinguishes and classifies leukemia components
Analysis of red blood cells by 3-angle optics
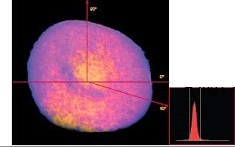 |
Improve the accuracy of red blood cell parameters, including reticulocytes by 3-dimensional optical analysis:
optical 00, 100 and 900.
|
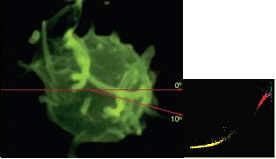
Platelet analysis by 2-angle optics
Platelet results are reported even more than abnormal samples.
- Analysis of two angles separate platelets and erythrocytes.
- Minimize interference due to small red blood cells, broken red blood cells, red blood cell debris, or non-platelet components.
- Reported results increased:
- No need to rerun or charge extra chemicals
- Even when clumped platelets or giant platelets are present thanks to 2-angle analysis
- The sample has decreased platelets, and
- No further dilution is required when the sample has increased platelets
Specifications
| PRODUCTIVITY | Formula blood + leukemia components:
up to 84 tests / hour |
| SAMPLE VOLUME | Open Mode 150mL, Sample Loader 230mL |
| CHEMISTRY | 4 chemicals including reticulocytes |
| SKILL | |
| PLATE & THE
INGREDIENT |
MAPSSTM: 4 angle optical laser |
| PLATELET | 2-angle optics, no chemicals added, no repetition |
| RETICULOCYTE | National Committee for Clinical Laboratory Standards (NCCLS) with New Methylene Blue |
Data management
- The system works based on Microsoft Windows
- Touch screen
- Full quality check on the machine
- Summary statistics and Levey-Jennings graphs
- Transfer medium (including leukemia components)
- Westgard Rules
- Store 10,000 results with the chart
- Program the patient and report
- Patient information (name, date of birth, patient code, doctor appointing)
- Barcodes: Code 39, Codabar, Code 129, Interleaved 2 of 5, ISBT
- Self-calibrate according to the instructions on the machine
- Computer diagnostic program and help video
Operating temperature
- 150C to 300C (590F to 860F)
Humidity
- Relative humidity £ 80%
- Indoor use
Compliance with safety standards
UL CSA
IEC 1010
CE Mark
Parameter
| White blood cells | Red blood cells | Platelet | reticulocyte |
| NOC WOC NEU
%N LYM %L MONO %M EOS %E BASO %B |
RBC HGB
HCT MCV MCH MCHC RDW Retic %R |
PLT MPV | RETIC# RETIC% |
Electrical Power
| Telegram | Frequency | Maximum intensity | Maximum power consumption | |
| Analyzers | 100-240V | 47 / 63Hz | 0.5-2.2 amps | 550W |
| Screen | 100-240V | 50 / 60Hz | 1.5 amps | 50W |
Size
| High | Wide | Deep | Mass | |
| Analyzers | 49.9cm (19.25 in.) | 86.4 cm (34.0 in.) | 76.8 cm (30.25 in.) | 105.2 kg (232.0 lbs.) |
|
Printer |
According to the printer manufacturer |
|||